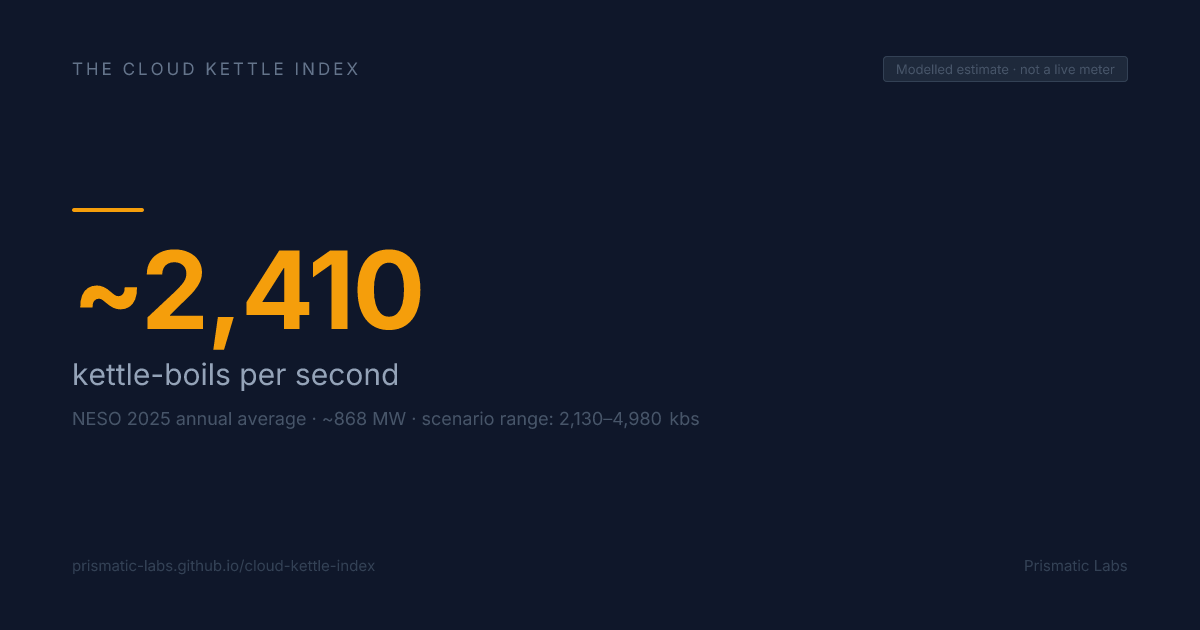
Data-centre electricity demand, shown in kettle-boils per second
The Cloud Kettle Index estimates how much electricity Great Britain’s data centres use, then translates that load into kettle-boils per second. The point is simple: make a hard-to-picture part of the grid easier to see.
Estimated data-centre share of GB demand right now
Fetching live GB demand…
The live grid is public. Measured data-centre load is not. This site uses the best public sources I could find.
Central estimate: The National Energy System Operator (NESO) estimates GB data-centre electricity at 7.6 TWh/year from 2.4 GW of connected facilities (Future Energy Scenarios 2025, confirmed in Parliament POSTnote 762, March 2026). 7.6 TWh ÷ 8,760 h = ~868 MW average. At 0.36 MW per kettle-boil/sec, that is ~2,410 kbs.
Scenario range: The Department for Science, Innovation and Technology (DSIT) estimates 1,600 MW of colocation IT capacity in GB (autumn 2024). Applying utilisation (40–70%) and Power Usage Effectiveness (1.2–1.6) gives 768–1,792 MW (2,130–4,980 kbs). The NESO central estimate sits within this range.
Modelled data-centre share of GB demand - last 24 hours
When national demand falls overnight or on quiet days, always-on loads take a larger share of the grid - even if their own consumption is only modelled as roughly steady.
How data-centre load varies through the day
Measured utilisation profiles from 96 anonymised data-centre sites in the UK Power Networks (UKPN) licence area - the distribution network covering London, the South East, and the East of England. Profiles are derived from 3.4 years of half-hourly readings (January 2023–April 2026). The y-axis shows relative load: 1.0 is each site’s own average. Values above 1.0 mean busier-than-average; below 1.0 means quieter.
Weekday: load varies by at most 5.8% across the day; overnight is 3.9% lower than the midday peak on average.
Sites are anonymised; raw data is not exposed. UKPN licence areas are not national GB coverage - profiles may differ elsewhere. National scale from NESO 2025; this chart shows shape only.
Help find the real figures for data-centre demand
The Cloud Kettle Index uses public estimates because measured data-centre load is hard to access. Environmental Information Requests let you ask public bodies what figures, forecasts, planning assumptions, and grid-impact evidence they hold.
Your area
Enter a postcode to look up two things: the DSIT-estimated colocation data-centre IT capacity for your region (from DSIT’s 2024 national survey, aggregated at regional level), and the current carbon intensity of your local electricity supply.
Your area
Enter a Great Britain postcode to see the modelled data-centre capacity in your ITL1 region.
Methodology
The formula, data sources, assumptions, and what this site does not claim.
Read the methodology →Help make the data open
Ask public bodies for the underlying evidence using an Environmental Information Request.
Create an EIR →vetch
Planet-aware LLM observability with circuit breakers for runaway cost, energy, and carbon.
GitHub →